Geospatial Data Aids Emergency Response
 |
| This view of Churchill Downs racetrack in Kentucky illustrates how the Spatial Templates for Emergency Preparedness, or STEPs, system allows users to underlay images beneath geospatial information data. |
A Web-based decision support system developed by private industry and university researchers allows government and military emergency responders to build situational awareness pictures of an unfolding crisis. The support tool taps data from diverse sources, translates it to a common database and presents it according to user needs.
The system incorporates geospatial information system (GIS) data to guide users through its situational display. Other, more mundane, data can be added for call-up when needed. Streaming video and instant messaging round out a capability suite that provides users with GIS-supported surveillance information to help direct commanders dealing with a dynamic situation.
The capabilities inherent in this advanced decision support tool can serve users at both the enterprise and first-responder levels. A recent technology demonstration employed its capabilities in the joint emergency operations center at the Kentucky Derby. Businesses as well as government and the military can exploit its management characteristics. It also can serve as a Web-based tool to provide information back to the public.
The new system is known as Spatial Templates for Emergency Preparedness, or STEPs. Developed by Plangraphics Incorporated, Frankfort, Kentucky, the system was built around technology the company acquired and then developed further with the aid of Kentucky’s University of Louisville Homeland Defense Technology Center. Michael Langley, vice president, public sector for Plangraphics, describes STEPs as a user-friendly system providing operators with access to disparate information, in terms of formats and source locations, through a single Web portal.
Langley notes that STEPs owes some of its origins to work the company performed for New York City before and during September 11, 2001. The company has been providing GIS data to a centralized databank since the 1970s. The design and architecture of that system, which was used extensively immediately after the terrorist attacks, are components of the STEPs architecture.
STEPs uses an Oracle database along with Oracle spatial capabilities. In addition to processing and storage capabilities, these components offer multilevel security. STEPs uses Fire middleware from Xmarc in Australia. This middleware includes database connectors and data format translators, which provide the ability to identify sources of data and retain that information for later use. It also permits reaching out to a variety of disparate formatted information in different locations, retrieving it, translating it and displaying it via the system’s Web portal. A user can view a form of data without having its originating software on the user’s desktop computer.
Langley emphasizes that this architecture will support a number of applications outside of emergency preparedness. These include critical infrastructure protection, asset management, economic development and executive decision making from diverse information sources and types. Under consideration is an effort to integrate traditional business application data with spatial components.
STEPs provides several display and function capabilities. Users can zoom in on or out of map data. Langley explains that ESRI, MapInfo or Intergraph can be used to create and maintain the GIS data. The data is converted for storage in the Oracle database and displayed via Fire middleware in the Web portal.
In addition to its GIS capabilities, the system can perform global positioning system (GPS) or automated vehicle system tracking. It can incorporate and integrate alert notification software, which often includes text-to-voice and messaging capabilities along with targeted directories. This ability will allow officials to designate an evacuation area for STEPs to present relevant addresses and even telephone numbers for automated emergency notification.
A streaming video capability allows the system to incorporate video imagery from standard traffic cameras. STEPs also allows its users to change camera views from a great distance.
Three-dimensional visualization software enables users to see a jurisdiction from different perspectives. Aerial photography and satellite imagery can be blended by software to generate the three-dimensional picture. Given access to a computer aided design (CAD) drawing of a building, STEPs can generate a georeferenced image on a map by translating that CAD drawing without having AUTOCAD software on the user’s machine.
Langley says that planners are looking at STEPs being interoperable to access federal, state or local information in either direction. So far, engineers have not encountered any data that cannot be used in the application. The only requirement is access, as many state and local governments have restrictions on data sharing across agency lines. STEPs can be integrated with other crisis information management applications to pull in information such as an emergency response resource log. With this capability, a user could click on a map location to view a response log for that spot.
A tab on the side of the screen can serve to activate the crisis management software. STEPs does not need to display all aspects of a crisis information management system, Langley explains, as it can be configured to show only the status of specific resources allocated for response.
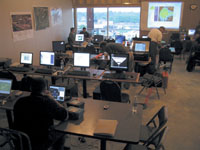 |
| Emergency responders at the 2004 Kentucky Derby monitor events from an operations center at Churchill Downs. The large wall screen displays a weather radar image tracking severe thunderstorms that immediately preceded and followed the famous race. |
Analytical simulation packages also can be integrated into the system. Users can incorporate plume-modeling software, for example, to view the results of a hazardous substance spill under various conditions. Langley emphasizes that it is easier to integrate software applications that are built atop an Oracle database because of the commonality with STEPs.
STEPs was field tested during the annual Thunder Over Louisville event, a multiday celebration featuring fireworks and air shows around the time of the Kentucky Derby. This event involves about 700,000 people lining the Ohio River along a several-mile stretch. The Federal Protection Service, the Federal Bureau of Investigation, the U.S. Marshal Service and the U.S. Coast Guard, as well as state and local organizations, used the system.
Brad Learn, deputy director of the Louisville/Jefferson County metropolitan emergency management agency, explains that STEPs took the form of a technology demonstrator during this event. The University of Louisville’s Homeland Defense Technology Center, which is putting together technology solutions to assist emergency management and operations, incorporated STEPs into its technology retinue. The goal was to generate a host of solutions that would assist the emergency agencies operating at this event and at the Kentucky Derby two weeks later.
The system’s utility lay in its ability to incorporate a tremendous amount of information that could be exploited by numerous users simultaneously, Learn declares. By allowing multiple users to look at different areas of interest, STEPs facilitated event management coordination without limiting users to only one person’s area of interest.
The necessary data for STEPs was provided by Logic, a consortium in the Louisville/Jefferson County area that is funded by infrastructure organizations such as local utilities and city government. This high-quality data was provided in coverage format for conversion to the Oracle database.
Learn relates that the STEPs operation was based in the emergency operations center in City Hall. Accordingly, users were working through the city’s firewall system. Officials had to adjust access back and forth to meet the firewall requirements.
Langley admits that some problems did arise. Wireless units did not perform as well as hoped because downtown buildings interfered with signal reception. Also, organizational firewalls prevented some users from being able to access necessary information.
Learn also allows that the system could use a faster refresh rate. Because most of the information on a screen does not change, researchers are looking at repainting only the parts of the screen that change.
Two weeks later, STEPs was stood up for the Kentucky Oaks, the filly race that immediately precedes the Kentucky Derby. Company designers incorporated information about Churchill Downs racetrack that was provided by the local law enforcement community. This information included the grid map that is used for identifying incidents within the boundaries of Churchill Downs. Aerial imagery of the Churchill Downs area was underlaid with GIS data.
Unlike for Thunder Over Louisville, a joint emergency operations center was established on-site at the racetrack. University researchers set up and operated a local area network to run the system.
Several improvements based on user feedback from Thunder Over Louisville were incorporated on the eve of the two races. Wireless units worked much better at the racetrack. The single most used feature was the weather radar tracking capability, as officials were tracking numerous thunderstorms that plagued the region on Derby day. One terminal projected its display on a large wall screen, which proved useful for tapping the weather resources inherent in the system. Most of the time, officials viewed weather radar on that large screen, and they were able to foresee the arrival of thunderstorms with five minute’s accuracy.
Another concern arose regarding a tunnel that ran under the track to the infield area. Officials were worried that spectators might rush into the tunnel to seek shelter from a downpour. So, prior to the arrival of the squall line, the police department dispatched additional officers to the tunnel to aid in crowd control. Officers with video cameras at each end of the tunnel provided situation monitoring for the command center.
Learn relates that the system permitted command post officials to view live streaming video from a variety of areas. Operators could click on a GIS-input map to see the video feed available from that spot, and they could view other related information about that location. Other GIS displays would permit virtual flyovers of potential traffic bottlenecks.
Langley notes that the system incorporated several new categories for incident reporting based on racetrack needs—fights, drunk and disorderly, and crowd control took their place alongside existing capabilities for dealing with major accidents and environmental disasters.
The two events provided different GIS challenges. For Thunder Over Louisville, the physical size of the event called for large-scale information. For the Kentucky Derby, users needed more detailed data such as individual building floor information.
Instant messaging worked well throughout both events. However, Learn states that operators could use an incident log that would receive event information from key individuals. This scrolling log would provide both incident and time data.
Next year, the system is slated for inclusion in the U.S. Northern Command’s Coalition Warrior Interoperability Demonstration, or CWID. The successor to the Joint Warrior Interoperability Demonstration, or JWID, this exercise will focus on the interaction between military units and first responders at the federal, state and local levels. The University of Louisville Information Technology Research Center and the National Guard 41st Civil Support Group, which is a weapons of mass destruction response unit, will join Plangraphics as the STEPs team.
For the future, engineers are working on several upgrades to STEPs. Langley relates that the company has opened a dialogue with a Kentucky National Guard helicopter unit that provides surveillance services to the state. The goal is to enable STEPs to carry streaming video from this helicopter surveillance in the same manner that television news helicopters broadcast live video on the evening news.
Langley adds that Xybernaut of Fairfax, Virginia, has a powerful handheld wireless unit that can access STEPs. Plangraphics is working to develop both streaming video to those units and a GPS tracking capability of them. Bandwidth limitations currently slow down the process, he notes, so engineers are looking at compression software to speed up the dataflow.
He adds that the firm’s vision of the system is that it would establish a national standard that would permit a user to click on any state and see a display of all of the STEPs applications developed within that state. These applications would include state and local government levels as well as critical infrastructure organizations.
The company is partnering with several other firms to enhance the system’s capabilities. For example, one firm can provide building details down to the structure’s plumbing. This application could be added to the existing STEPs capability to allow a user to drill down even deeper into a building’s infrastructure. Other companies may be able to provide new components that permit integration of more information, including even hospitalization information or pharmaceutical sales data that could help alert authorities to biological pathogen outbreaks.
Adding expert intelligence would permit the establishment of pre-programmed responses. Alerting the system to an oncoming hurricane, for example, would trigger a display of the tabs that would be needed in that situation.


Comments