Center Turns Data Into Maps
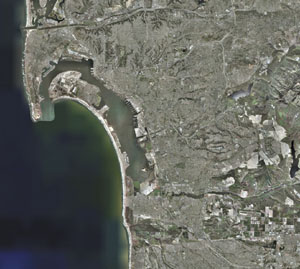 |
| The Visualization Center at San Diego State University (SDSU) used one-foot-resolution imagery to create a three-dimensional model of San Diego County for first responders. |
Pictures may indeed be worth a thousand words when applied to visualization aids for warfighters and first responders. A university-based facility is using state-of-the-art computers and software to convert large data files into maps for a variety of organizations. This free material is made available to government agencies, academic research groups and companies that require high-resolution terrain imagery.
A part of
The
Graham says that the SDSU center serves the public by training and interacting with it. The center is constantly receiving requests from hundreds of different groups for data or image processing capabilities. The facility also has in-house expertise and can develop solutions on-site. “If somebody asks us a question we don’t know the answer to, that’s just an excuse to go learn something,” he says.
One of the key applications the center uses is the Geospatial Data Abstraction Library (GDAL), an open source software toolkit for geospatial information system (GIS) programmers and users. Graham explains that the facility’s open source GIS tools rely on the GDAL library set to perform special imagery file functions. An advantage of open source GIS applications is that if a difficulty occurs, users can post a message and have the problem quickly solved by a network of scientists at SDSU and other affiliated research centers. For example, an anomaly Graham found in an elevation data set was corrected within 15 minutes of posting a request for assistance. “You can’t do that with any other technology outside of open source. If you ask a company to make a change for you, you probably wouldn’t find the department that was changing the code, let alone the guy who was writing the code,” he says.
Data sets sent to the center are processed to remove anomalies and noise before they are visualized. Graham explains that many GIS tools cannot process as much data as the center’s computers and software. The center’s most powerful GIS imaging application is the GeoMatrix Toolkit developed by GeoFusion Incorporated, which can create three-dimensional maps using satellite images superimposed on terrain elevation data.
The
Other groups such as the U.S. Navy,
GDAL technology allows data to be configured for use in terrain and other types of maps quickly. This speed is a major advantage of using Open GIS Consortium (OGC) technology. He notes that the OGC has a strict set of compliance rules, but tools meeting these requirements will plug into other users’ systems. For example, the center has a Web site that features imagery of the region affected by Hurricane Katrina. The site has an applet in the upper right-hand corner of the Web browser page that allows users from the devastated areas to see whether their houses are still standing. A user enters the home address, which is then converted into latitude and longitude data, launching another Web page that includes the specific aerial photograph. Users also can pan the map. Graham notes that a programmer installed this feature in about 15 minutes onto the center’s OGC-compliant system. “The social network and standards immediately allowed us to aggregate and bring a capability to an emergency where people needed to find things where there were no street signs or houses left,” he says.
By overlaying high-resolution satellite images onto maps of affected
The U.S. Department of Housing and Urban Development (HUD) requested similar data for its assisted housing in the
The center recently hosted NASA’s Blue Marble data, which is a map mosaic of the entire planet. Graham relates that the original version of the map was one kilometer per pixel; the latest version is 500 meters per pixel and was automatically compiled and assembled by computer. “We now have a snapshot of 2004. This next-generation Blue Marble has a data set for every month of the year,” he says.
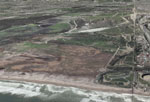 |
| SDSU scientists laid high-resolution aerial photographs on top of three-dimensional terrain data to create a map of the California-Mexico border for the U.S. Border Patrol. |
The center also is processing a global mosaic of 15-meter resolution Landsat7 images that soon will be released to the public. Because it is a massive data set, Graham explains, the mosaic will first be released as 1.7 terabytes of data that can be downloaded and converted into maps. The
Organizations can freely access the raw data from the center. This same approach is used for requests for processed or “cooked” data. Graham explains that if the information can be publicly shared, the center will process it.
In addition, the center supported a major civilian-military exercise in
The mapping technology helped determine where to place wireless hot spots to create a network on the
One group participating in the exercise was the United Nations’ joint logistics officers. Graham notes that this organization was involved in the tsunami relief efforts in
A Silicon Graphics Incorporated (SGI) eight-processor, 24-gigabyte random access memory Prism system provides the
Graham adds that this system is not a grid system of four separate machines with two CPUs but rather a single rack with linked CPUs connected by high-bandwidth data pipes. As a result, the multiple processors operate as a single computer. “The amount of bang for the buck that I get out of it is incredible compared to operating a grid,” he says.
The Prism’s architecture allows image-processing applications to use all of its CPUs simultaneously, unlike many multi-CPU machines where only one or two processors do most of the work. But Graham and his team use the full capability of the Prism machine and its software. It can create new data sets by processing 500 or more image files up to 200 megabytes to generate mosaics of at least a terabyte in size overnight. “We try to squeeze every little bit of power out of it [the system],” he says.
In the near future, Graham plans to recompile all of his system’s code with an Intel C compiler, which could allow some applications to run up to 600 percent faster. However, he notes that although he expects improvements, he does not anticipate an across-the-board increase of 600 percent nor anything approaching this level in areas that are improved.
Graham also hopes to acquire an Intel field programmable gate array (FPGA) module that accepts embedded algorithms. This would allow the system to operate functions such as pan sharpening and image projection in the FPGA instead of the CPU so these applications can run faster. “We’re doing map surveys and image processing, so there are many different things that we do all the time that can really take advantage of that type of technology,” he says.
Web Resources
GeoFusion Incorporated: www.geofusion.com
DigitalGlobe: www.digitalglobe.com
Comments