Detecting Change With Artificial Intelligence
In a project for the Defense Department’s Defense Innovation Unit (DIU), computer scientists have turned to artificial intelligence and aerial imagery to construct a detailed damage assessment solution. The tool can be used remotely and automatically to determine the amount of damage to buildings and structures from a natural disaster or catastrophe. The prototype, known as the xView II model, was tested this fall, with the goal of rolling out a more finalized operational version next year.
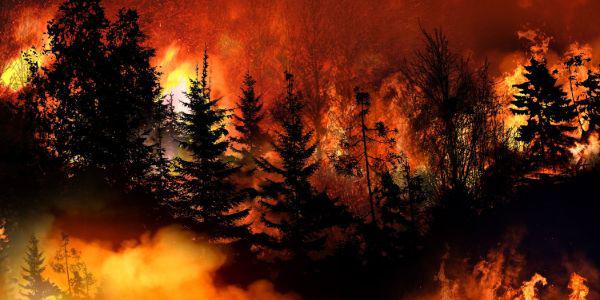
In the last few years, the U.S. military has seen an enormous amount of weather-related damage to some of its facilities, including the destruction at Tyndall Air Force Base, Florida, from Hurricane Michael in 2018; extensive water damage at Camp LeJeune, North Carolina, from Hurricane Florence’s torrential rains in 2018; and flooding of the Missouri River and area creeks that impacted one-third of Offutt Air Force Base, Nebraska, in 2019. Meanwhile, this fall, California’s wildfires raged over 4 million acres causing irreparable damage, while repeated hurricanes barraged the Gulf Coast.
Organizations providing humanitarian assistance and disaster relief, or HADR, need access to comprehensive and timely information when providing relief and damage assessments in such catastrophic circumstances. The crucial assessment information feeds into being able to declare a state of emergency, and it assists in the determination and activation of recovery resources.
Usually, organizations rely on in-person verification of the damage caused by storms or fires, which is risky and time-consuming, explains Ritwik Gupta, a machine learning scientist and principal investigator at Carnegie Mellon University’s (CMU’s) Software Engineering Institute (SEI), a federally funded research and development center, which is preparing artificial intelligence solutions for the DIU, amongst other efforts.
“One of the biggest problems that faces our first responders today is building damage assessment,” Gupta shares. “Building damage assessment is actually a very critical task that happens early on in order to support the rest of the disaster response. But it is a very dangerous task. For example, with the wildfires in California, [they] pretty much have a 24- to 48-hour period to go in, figure out what buildings are damaged, how badly damaged they are, and where the damage occurred. They are sending people in person, and there may still be fires going on. There will be downed power lines, all sorts of hazards in the environment putting people’s lives at risk.”
And while the California Department of Forestry and Fire Protection, known as CAL FIRE, and the California Air National Guard already rely on drones and helicopters to take infrared and other imagery for damage assessments, their reach is limited to certain areas, Gupta says. Instead, remote sensing, combined with advanced algorithms, computer vision, object detection, pattern recognition, an advanced data set and satellite imagery as part of the xView II prototype, provides a much more extensive and quicker response.
“With satellite imagery, we can capture a huge area very quickly,” he explains. “With the amount of satellites that we have, we can have eyes on an area within minutes, or at least within hours. [With] that imagery, we can now create the intelligence, and then algorithms automatically assess building damage using that imagery.”
Gupta, his team of researchers at SEI, and Lt. Erick Pound from New York Fire Department’s Incident Management Team, worked closely with Nirav Patel and Bryce Goodman, DIU program managers (PMs), to develop the prototype.
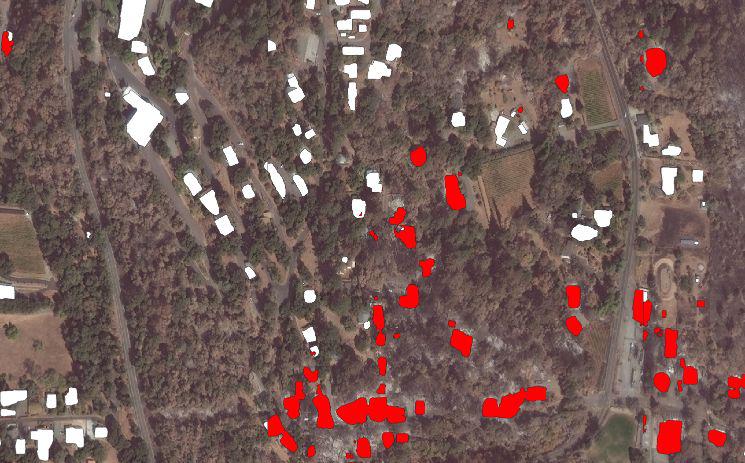
The solution employs the xBD data set, created by Gupta, Patel, Goodman, Howie Choset, Richard Hosfelt, Sandra Sajeev, Jigar Doshi, Eric Heim and Matthew Gaston—presented in their paper entitled, “xBD: A Dataset for Assessing Building Damage from Satellite Imagery.” xBD employs more than 45,000 square kilometers of satellite imagery accessed from the National Geospatial-Intelligence Agency and commercial partner, Maxar Technologies.
The xBD data set is a powerful tool for the U.S. military and other organizations, Gupta ventures. “The reason why xBD is so revolutionary for this research field is because it is the largest data set of its kind,” he explains. “It provides pre- and post-disaster imagery along with building polygons and labels for those polygons as per the level of damage. And the Defense Department is one of the largest forces in the world. When there are disasters, the Defense Department is usually one of the first organizations onsite, whether it is the National Guard or the Marines or the Air Force. They can use these models and this data set in a lot of really cool ways.”
One hurdle for the team to use the data set was the creation of a damage scale—essentially how to label the imagery data in xBD. “Different analysts have different ways of looking at the data,” Gupta notes. “For example, FEMA [Federal Emergency Management Agency] uses this thing called HAZUS that they use to annotate different types of building damage, but it is primarily for hurricanes and earthquakes. And that is very useful, but that’s not what CAL FIRE uses to assess wildfire damage in California for residential buildings. The scales are very different. And so, when we went to sit down and annotate this imagery for buildings and damage, we found they didn’t have a set scale, and we didn’t have agreement across analysts in regard to what matters.”
The SEI researchers brought together numerous agencies, including CAL FIRE; the California National Guard; FEMA; NASA; Indiana National Guard; and the U.S. Geological Survey, together on several conference calls to figure out how to develop a joint scale and how many levels of damage to include. The artificial intelligence specialists also had to ensure that the damage scale was useful for their machine learning algorithms, Gupta emphasizes. The resulting scale, called the joint damage scale, goes from zero to three levels of determined damage: no damage, minor damage, major damage and destroyed.
“Do you want 10 different levels of damage, three levels of damage or five levels?” the principal investigator shares. “We settled on four. We want to assess any type of disaster. It’s not just wildfires or earthquakes. We want to do volcanic eruptions, hurricanes, landslides, whatever. And what are the features that actually represent damage? You have to get to the core of that.”
The joint damage scale includes qualitative descriptions of what constitutes “no damage” or “minor damage,” the principal investigator explains.
The completed xBD served as the baseline data set for DUI’s successful xView II Challenge, which ended in January 2020 and had 2,000 submissions from competitors in 20 countries. The event focused on spurring the computer vision industry to compete and present computational solutions that accurately localized buildings in overhead imagery and scored the severity of building damage.
“It is a prize challenge that focuses on how do we best combine artificial intelligence and remote sensing to help people and actually get operational use cases out into the [Defense Department] community,” Gupta states. “And the best way to do that, and the most impactful way to do that is to help our first responders, whether that be the people at CAL FIRE or at the California National Guard or even the duty personnel that respond to a disaster directly. And we wanted to make sure that there’s a valid transition pathway that we can get this deployed into the field.”
DIU, with help from CMU SEI and others, is currently planning the xView III Challenge for Spring 2021. The event will test interested competitors’ abilities again through a new (and not yet disclosed) challenge meant to help attract further innovation to the HADR community.
In the meantime, examining the top five winning algorithms from the xView II challenge—which are all open source and available on the DIU’s GitHub webpage—the officials employed two of the models to create the xView II prototype.
“The first-place model was the most accurate,” Gupta shares. “And the fifth-place model was the fastest of them all. It has a lot of innovation to make it run very quickly. So, we’re just combining the best of both worlds and trying to get the best performance in the quickest amount of time.”
Because the challenge asked for certain outputs and unique specifications that worked for the competition but did not necessarily work well enough for real-world purposes, the officials have spent the last eight months engineering the xView II prototype, using the computer languages Python and PyTorch.
“Getting those [algorithms] over to a state that worked for our use cases took a lot of fine engineering,” the principal investigator continues. “All the integrations that we have to write and all of the optimization that we have to do on code that wasn’t even ours to begin with was also difficult.”
Their efforts paid off though when Gupta saw the machine learning modeling used in building damage assessment cases for FEMA battling hurricane damage or for the California officials experiencing the worst fire season in modern history. When new imagery was needed for the post-damage picture, the officials relied on the National Geospatial-Intelligence Agency and Maxar as well as the Civil Air Patrol, which regularly flies over areas of interest for the National Guard.
“We’ve been using xView II to help respond to the California wildfires, including the LNU, SCU, the Glass fire, the Silverado and the Blue Ridge fire,” Gupta observes. “And we have also been helping FEMA respond to Hurricane Laura, and we’ve been doing this for Hurricane Delta and Hurricane Zeta. We are basically helping provide preliminary damage assessments to these agencies so that they can do their task of accounts and resource allocation a little bit quicker and faster, and save on human resources all around.”
As he helps prepare for the xView III competition and works on furthering the xView II protoype, the principal investigator encourages the industry to consider developing solutions for disaster response.
“Machine learning, computer vision and artificial intelligence are very powerful tools,” Gupta stresses. “They can be used for a lot of things. And I don’t think that the world at large is paying enough attention to this world of disasters. The interest in disaster response is relatively not as well funded as some of the more lucrative remote sensing tasks like self-driving. But this is super important, as disasters affect us all. We all know someone who has been impacted by a natural disaster, and the more advanced technology that we can create to help responders do a better job, the better off we’re all going to be.”

Comments